Hardware Configuration used for testing:Table
Load JIRA Data Center on two nodes.
- Jira DC Node 1 v8.2.0 + RMsis 2.0
- Jira Dc node 2
Database: RDS instance on AWS with PostgreSQL was used for Database.
JIRA & RMsis were running over HTTPS behind the proxy offered via AWS.
A series of graphs is displayed below which displays the behavior in the above-mentioned configuration. The numbers on X-axis denotes the number of concurrent users accessing the RMsis while the Y-axis represents the time in milliseconds requires to complete each operation.
Table Load Statistics for various tables in RMsis
.png?version=1&modificationDate=1566904793444&cacheVersion=1&api=v2)
Release Table Load & SyncSync
.png?version=1&modificationDate=1566904794713&cacheVersion=1&api=v2)
Release Operations in Release Table
.png?version=1&modificationDate=1566904796849&cacheVersion=1&api=v2)
Operations in Traceability Table
.png?version=1&modificationDate=1566904799519&cacheVersion=1&api=v2)
Traceability table load and exitload
.png?version=1&modificationDate=1566904797793&cacheVersion=1&api=v2)
Operations in Test Case Table Operations
.png?version=1&modificationDate=1566904800454&cacheVersion=1&api=v2)
.png?version=1&modificationDate=1566904801425&cacheVersion=1&api=v2)
Operations on Traceability Table
.png?version=1&modificationDate=1566904802520&cacheVersion=1&api=v2)
Operations on Requirement Table
.png?version=1&modificationDate=1566904803470&cacheVersion=1&api=v2)
.png?version=1&modificationDate=1566904804188&cacheVersion=1&api=v2)
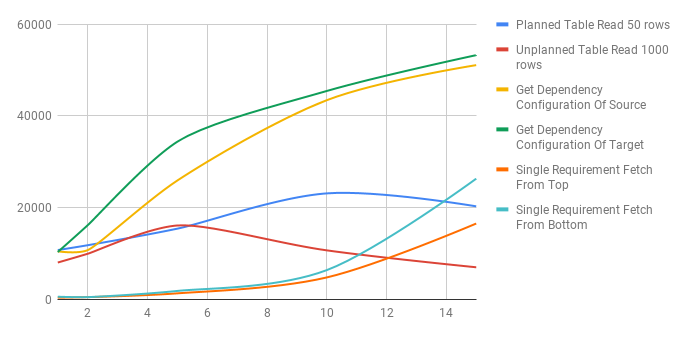
Conclusion: It can be noticed that the time to respond increases linearly as the number of concurrent users increases but the increase is linear and is expected for any application.
.png?version=1&modificationDate=1566904791521&cacheVersion=1&api=v2)